The Ticket Dashboard in HaloPSA
The Ticket Dashboard is the QuantumOps tab on a HaloPSA ticket: it shows what QuantumOps worked out about that one ticket and what to do next.
Written By Chris Scaminaci
Last updated About 1 hour ago
The Ticket Dashboard is the QuantumOps tab on a HaloPSA ticket. It shows what QuantumOps worked out about that one ticket, such as its health, sentiment, research and timeline, beside the ticket you are working. Technicians and dispatchers use it while they work a ticket.
Before you start: your administrator adds the dashboard to HaloPSA as a custom tab (see Adding QuantumOps tabs to HaloPSA). The tab opens inside HaloPSA and does not ask you to sign in to QuantumOps, so no QuantumOps role applies. If you open its address directly in a browser, QuantumOps shows an Access Denied page instead.
This is not the dialog that View Details opens on Home. That dialog is described in Ticket details, sentiment and sanity scores.
Read the status bar
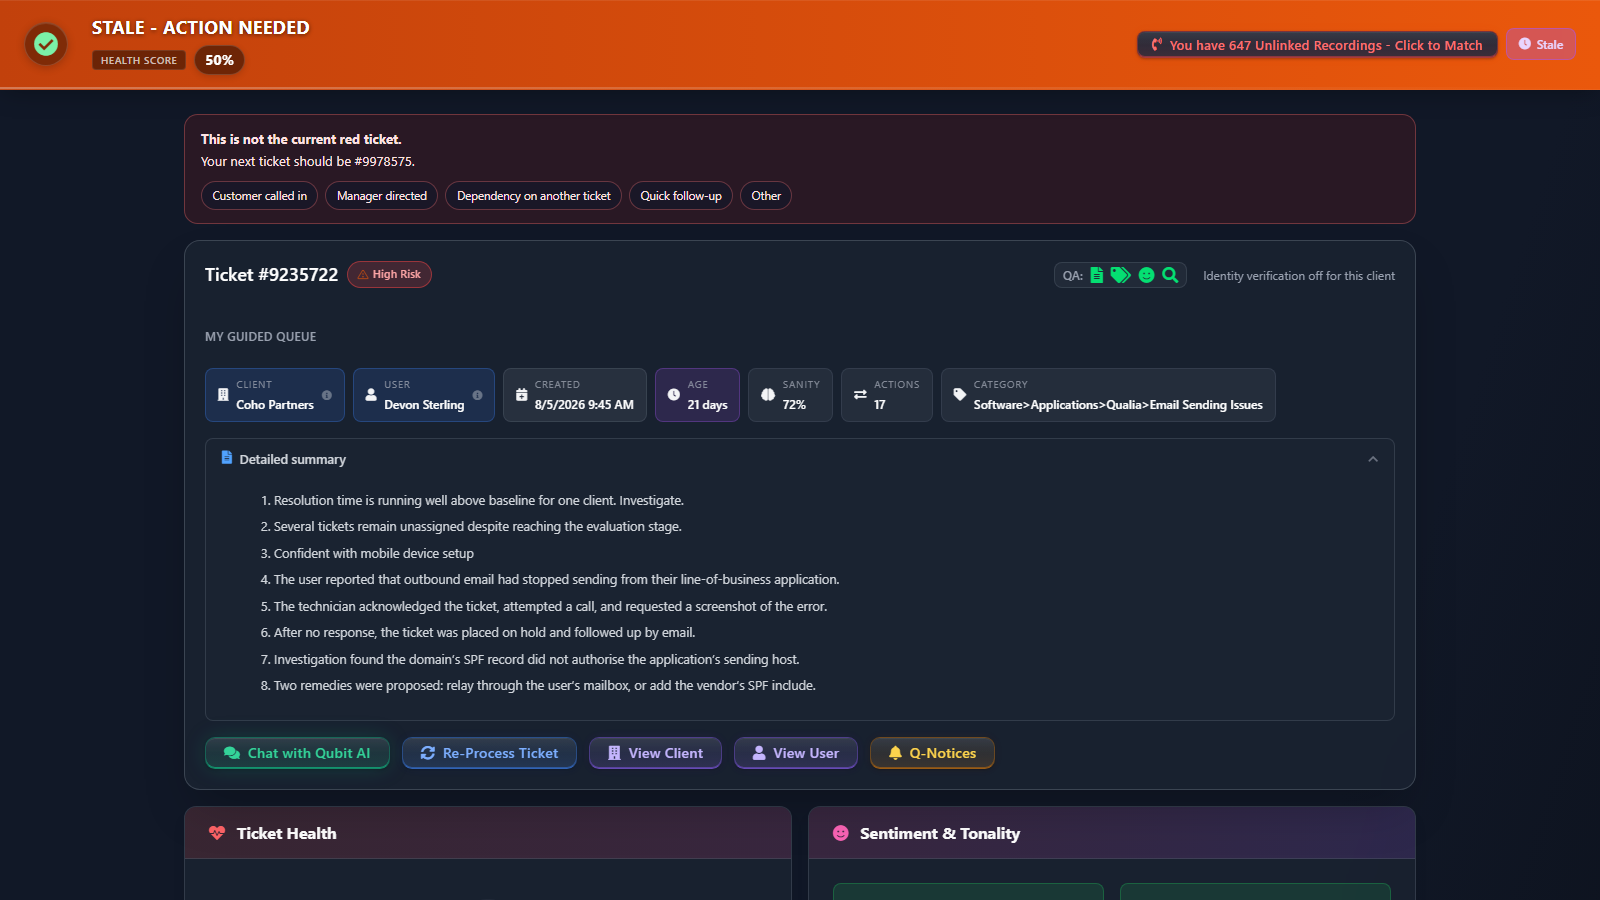
The coloured bar across the top gives the verdict on the ticket before you read anything else. It shows a verdict, the Health Score as a percentage, and a badge for each open alert.
The badges on the right of the bar are Sentiment, Tonality and Stale. Each one appears only when that alert is on for the ticket. See Sentiment and tonality alerts and Stale ticket detection for what raises them.
Each screen bands the health score differently; see Where the score shows.
When you have call recordings that are not linked to a ticket, a red button in the bar tells you how many and opens them so you can link them to this ticket. Matching your own recordings covers matching in full.
Read the ticket header
Under the bar, the header card holds the ticket number and everything you need to size up the ticket.
- VIP and High Risk badges come from the client's profile.
- On a white-label installation the header also shows the partner's name, the ticket's credit classification (for example Incident or Incidental) and the partner's credit use for the current period.
- The QA: strip has four icons for Summarization, Categorization, Sentiment/Tonality and Research. Each one is the status of that step for this ticket: green is done, blue and pulsing is running, red is failed and grey has not started. Hover over an icon to read its status. If a card further down the page is missing, this strip usually says why.
- When the client has identity verification turned on, the header also holds the verification panel and a badge that shows who last verified the caller. If the panel says Verify identity: sign in to this embed, your session is not yet identified. If it says Identity verification off for this client, the client is not enabled. See Verifying a caller.
Estimates
When historical estimation is switched on in the dispatcher workflow settings, the header shows two ranges: Resolution Estimate and Appointment Duration. Each range gives three figures in hours: Best, Expected and Conservative. Under them, QuantumOps shows how confident the estimate is, where it came from and, when it is based on past tickets, how many tickets it used. See Dispatch workflow and scheduling settings.
If the ticket has a booked appointment, a banner under the estimates gives its commitment, type, technician and time.
My Guided Queue
My Guided Queue lists up to ten tickets in the order you should work them. It appears when Enable guided work to zero is switched on in the dispatcher workflow settings and there is a queue to show. Each row shows the rank (#1, #2 and so on), the ticket number, a colour and a score.
If you open a ticket that is not your current red ticket, a banner reads This is not the current red ticket. and names the ticket you should take. The buttons under it are the reasons your organisation lets you give for working this one instead, such as a customer calling in. Choosing one records the override for review, and some reasons ask for a short note. See Override and feedback review.
Client and user badges
The metadata row shows the Client and User for the ticket, then Created, Age, Sanity, Actions and Category. Sanity is the percentage of agreement between two separate evaluations of the ticket. It measures how consistent the analysis is, not how good the ticket is, so a low value means a person should read the ticket.
- Hover over the Client badge to see Working with this client: communication style, service tier, what the client expects, escalation patterns and pain points.
- Hover over the User badge to see Working with this user: role, skill level, communication style and what the person knows.
- Click either badge to open the full profile.
The cards appear only when QuantumOps holds those facts for the client or user.
Detailed summary
Detailed summary is a collapsible section of written findings about the ticket. It is open when the page loads. Use the arrow on its right to collapse it.
Use the action buttons
Re-analysing a ticket uses AI, so each run spends tokens. It does not need you to verify your agent identity.
Read the analysis cards
Below the header the page shows cards. Some appear only when they apply.
- Ticket Health shows the health score as a gauge with the verdict from the status bar, then Sanity, Age and Actions, and the ticket's short summary.
- Sentiment & Tonality shows two separate readings, each with a score out of 10 and a category when QuantumOps has them. When a detailed reading exists, the card also lists Key Phrases and Recommendations. Recommendations are hidden when they amount to "No action required".
- Qubit Copilot - Suggested Actions lists actions QuantumOps proposes for the ticket. See Copilot suggestions and reply drafts.
- Sherlock Findings, Deep Investigation and Live Context show research and background about the ticket. See Sherlock research and live context.
- Research Results appears only on older tickets that have stored research but no Sherlock findings.
- Stale Analysis appears only when the ticket is stale. It explains why the ticket went quiet and gives Recommendations for restarting it.
- Ticket Timeline lists what happened and when. Chips on an event show the sanity and health scores at that point, Stale, and Trajectory Updated when the ticket's projected course changed. Runs of the same kind of event are grouped and expand when you click them. When QuantumOps has projected the next steps, they appear under the timeline as Projected Next Steps. Agent Assist turns the resolution paths into a guided walk-through, one step at a time.
The page updates itself while a ticket is being analysed, so you do not need to reload it.
Open a ticket that has no analysis yet
A ticket that QuantumOps has not finished analysing shows a status card instead of the dashboard.
Rarely, the card reads Ticket Not Found with a line of detail under it. That means QuantumOps has a status for the ticket but could not load its data. Reload the tab to check again.
Process Ticket Now and Retry Processing use AI, so they spend tokens. Neither needs you to verify your agent identity.
Related pages
- Copilot suggestions and reply drafts, for approving the actions QuantumOps proposes.
- Sherlock research and live context, for the research cards.
- Agent Assist (Interactive Guide), the next tab in the recommended order, which walks you through a resolution path.
- The Ticket Triage Dashboard, the same ticket from the dispatcher's side.
- Adding QuantumOps tabs to HaloPSA, for how the tab is set up.
- Home: the QA Pipeline, the list of analysed tickets.
Was this helpful?
Still need help? Ask the team